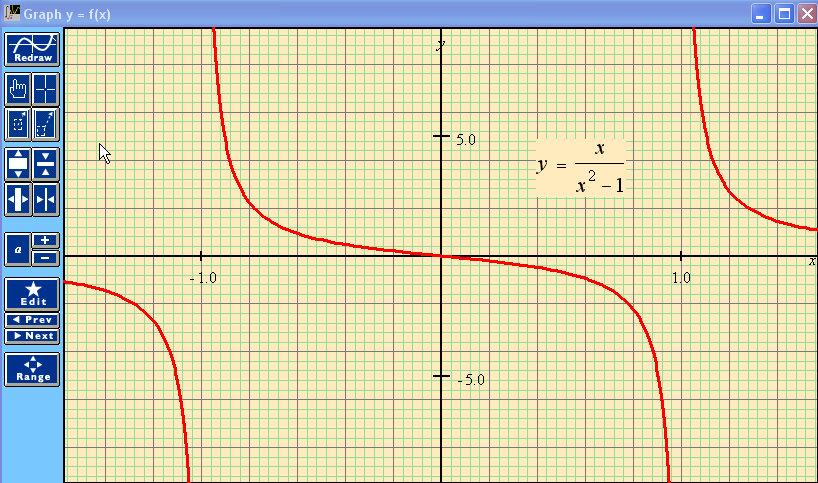
The most "ordinary" kind of graph is a graph of a function y = f(x). Such graphs nevertheless are sometimes hard to draw correctly. This example shows a case that your graphing calculator will probably get wrong. There are singularities at the places where the denominator is zero. Notice that MathXpert does not draw mistaken vertical lines there; it "knows" that those are singularities, rather than just places where the function goes suddenly from a large positive value to a large negative one, passing through the values in between. In fact, you can choose View | Singularities from the menu and see what the singularities of your function are. |
Help With Math: Purveyors of MathXpert
-->
